On the weekend of 11/14/2015, I went to MIGS. This was my first time and it was a pretty cool experience. One of my most memorable take aways from the conference was a talk I went to on the monday of MIGS about Optimizing and Profiling games made in Unreal Engine 4. This talk was done by Epic Games and it was 3 hours of pure information. In an effort to preserve as much of this information as possible, I wrote a ton of stuff down and have committed a lot of parts about this presentation to memory. However, my memory isn’t perfect and in an effort to have more people learn about these really cool and useful tools at their disposal, I have decided to create a lengthy blog post that highlights many of the topics covered at their talk.
Warning: This post is fairly technical and is targeted at people with prior experience working in Unreal Engine 4. It will also be lengthy so you have been forewarned.
Note: This post was written with version 4.9.2 in mind. If you are using an older or newer version, please keep in mind that some this might not be the same.
Tools
Unreal Engine 4 has a lot of tools built into it. Everything you could possibly need to make your game has come to you in a nice package, from particle system editors, animations, sound and more. But some of the tools that might be most important to making your game run well are not as prominent. You might not even know they exist and I am here to show you just a few of the really cool and useful tools at your disposal.
Important: A lot of these tools benefit from disabling frame smoothing. This is a feature which is on by default in Unreal Engine 4. You can turn this off here (Edit->Project Settings->General Settings->Frame Rate->Smooth Frame Rate).
Stats
Unreal Engine 4 has a lot of console commands that you can use while developing and debugging your game. These are accessible in the editor while playing your game by pressing the tilde key (~). You can also access it from the editor at the bottom of the Output Log. To see just how many statistics you can see for your game, just type the word stat and you’ll get over 80 options.
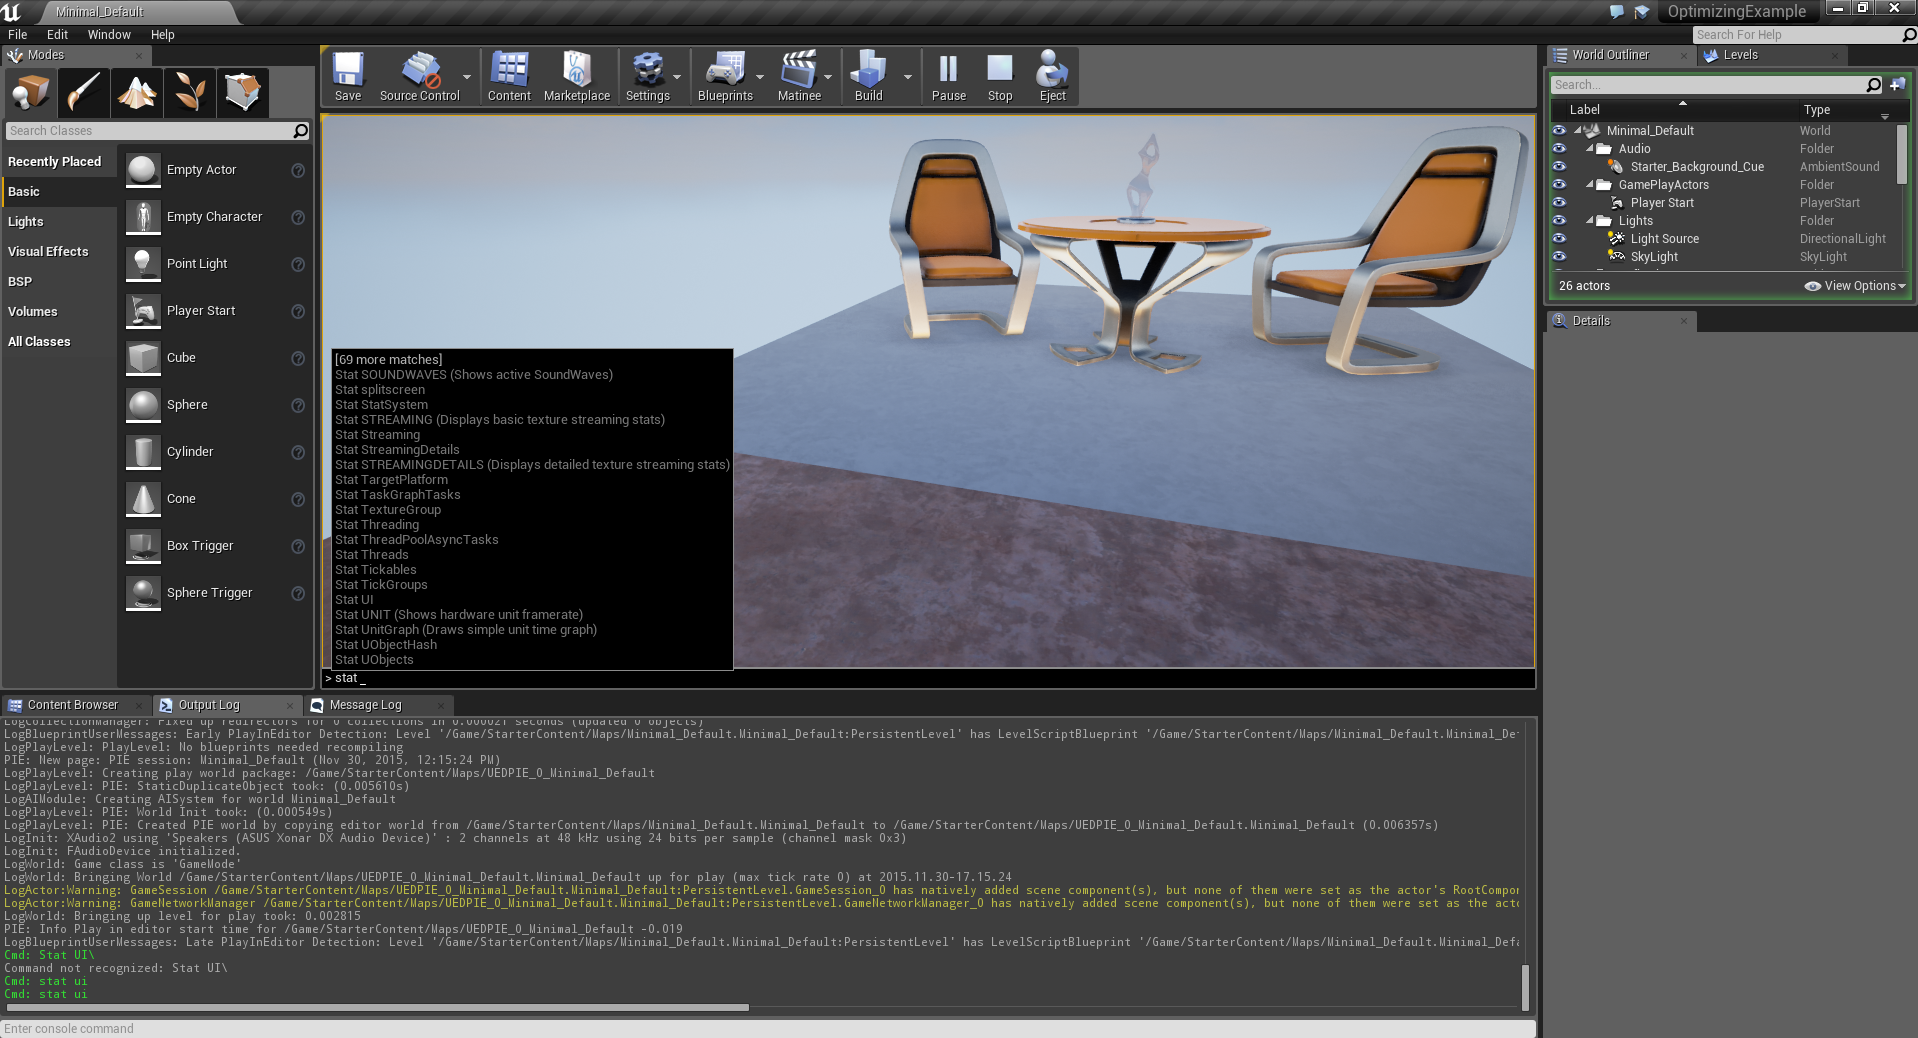
I highly recommend exploring different ones, but for now i’m going to show you two useful ones in particular. These are stat unit and stat unitgraph.
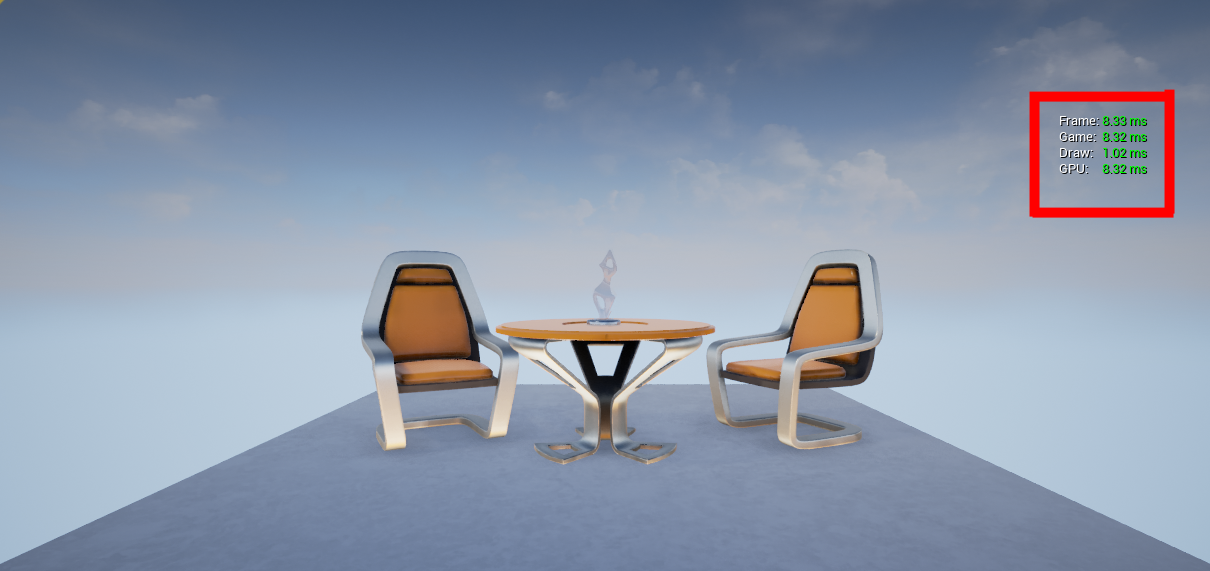
Stat unit will display information on how long it takes each part of your game to process each frame.
Frame is how long it took your frame to do everything.
Game is how long it took the game logic. This encompasses C++, blueprints and the engine itself.
Draw is how long it took to draw your scene (what you see in your viewport).
GPU is how long it took your GPU to do everything that was sent to it.
Now one thing to keep in mind when looking at these is that Unreal Engine 4 by default caps your framerate. This can be disabled in Edit->Project Settings->General Settings->Frame Rate->Smooth Frame Rate. Make sure this is disabled if you want to get accurate results for all the tools, including these. (Note: This should only be disabled in your project if you are profiling/optimizing your project at the time; unless your game needs it to be off. In most cases, this should remain on.)
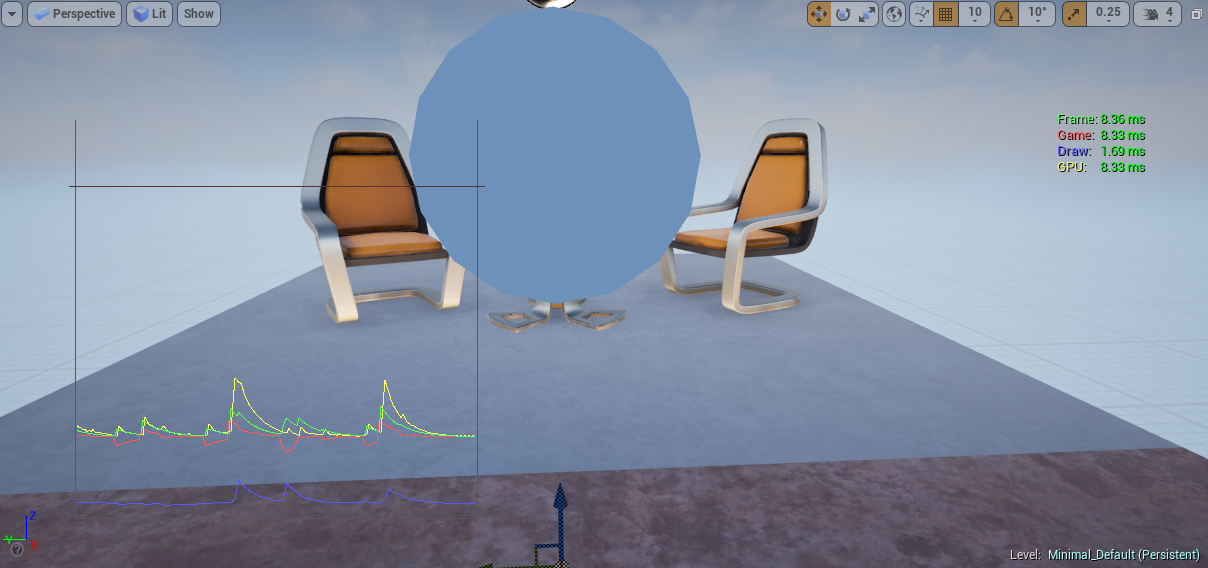
Stat unitgraph is similar to stat unit, but with two major differences. The first being that the text is now color coded (which I find very useful). The second main difference you might have noticed is that there is a graph. This graph visualizes the information for each frame and can potentially help you determine where things are going wrong when you see large spikes. Spikes also have more information attached to them when they scroll by. A well optimized game will likely have a very flat graph and few to no spikes. This doesn’t mean it is required, it is just a good sign.
GPU Profiler
Sometimes, you need to be able to see what your GPU is doing at any particular time. I don’t know about you, but i’m not able to speak GPU and I need some fancy tools to do that for me. Unreal Engine 4 has a nice GPU profiler which lets you see every little detail about what went on in the GPU on a particular frame. I would recommend using this if you notice your frame rate dropping, or if you see a spike on your unitgraph and want to learn more about what caused it. To activate the GPU profiler, all you need to do is type profilegpu into the console. This may take a few seconds so be patient. When it is done, you’ll see a popup like the one pictured below.
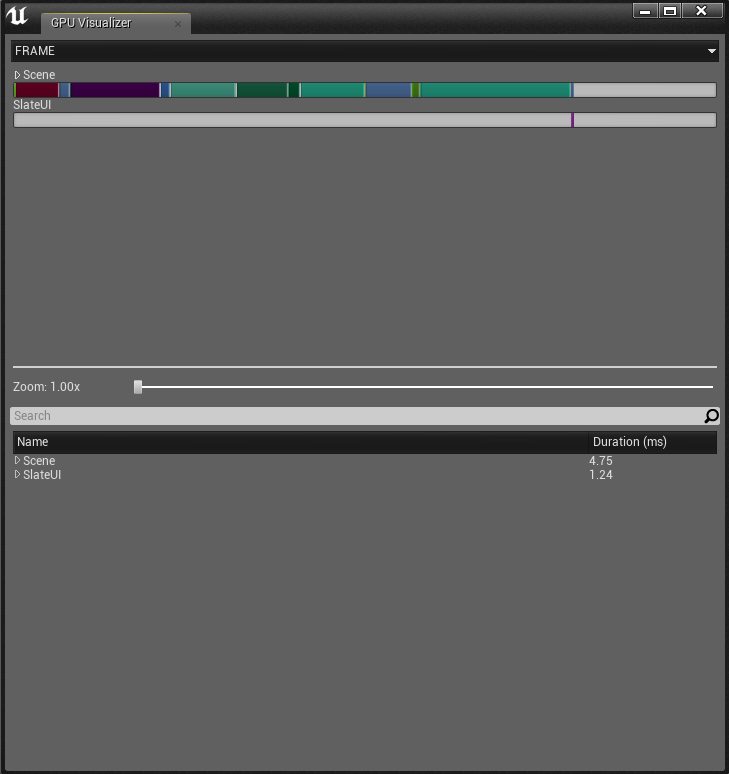
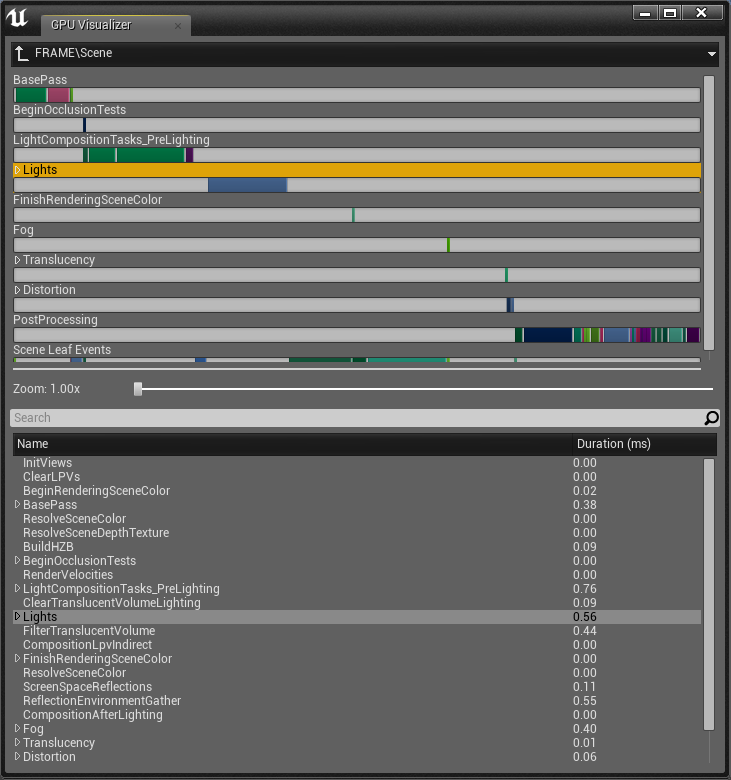
The GPU profiler allows you to see everything that was processed by the GPU over 1 frame. At the top, you see a colored bar with the word Scene over it. Mousing over individual segments of this bar will tell you what component it is. The length of the bar is representative of much time it took so things with a larger bar took much longer than things with a smaller bar. Clicking on a bar or the tiny arrow next to the word Scene will start to break things up further. I will use Light as my example, but this works the same for any other component like post processing for example.
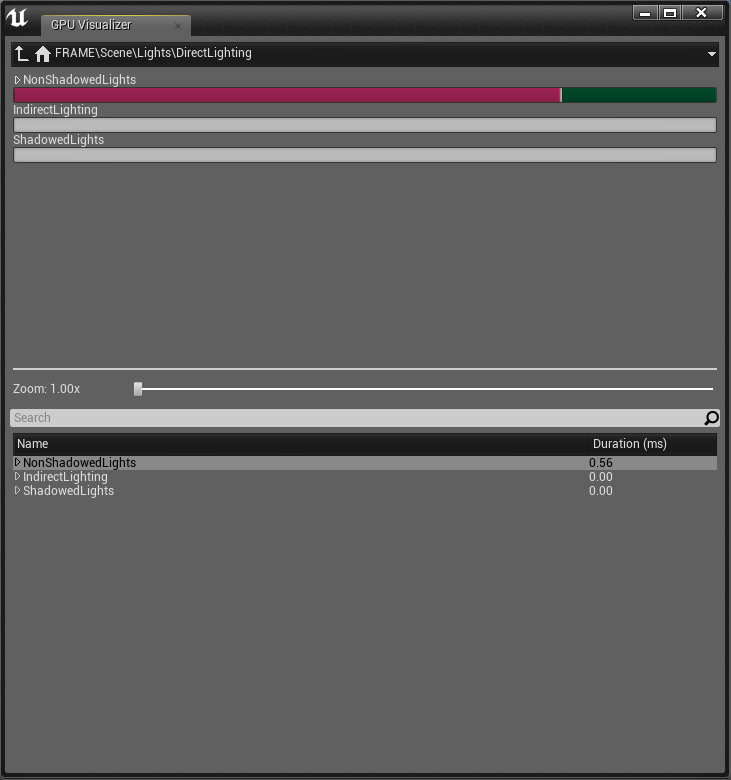
If I click the tiny arrow next to scene and click on the tiny arrow next to light, I get to see more specific components to the lighting of the scene. At the bottom, we can see different kinds of lights such as NonShadowedLights, IndirectLighting and ShadowedLights. By clicking the arrows next to these, we can expand it further and see more details. This can go as deep as you want to go. The point being that you can now see how an individual light affects the scene you are currently rendering.
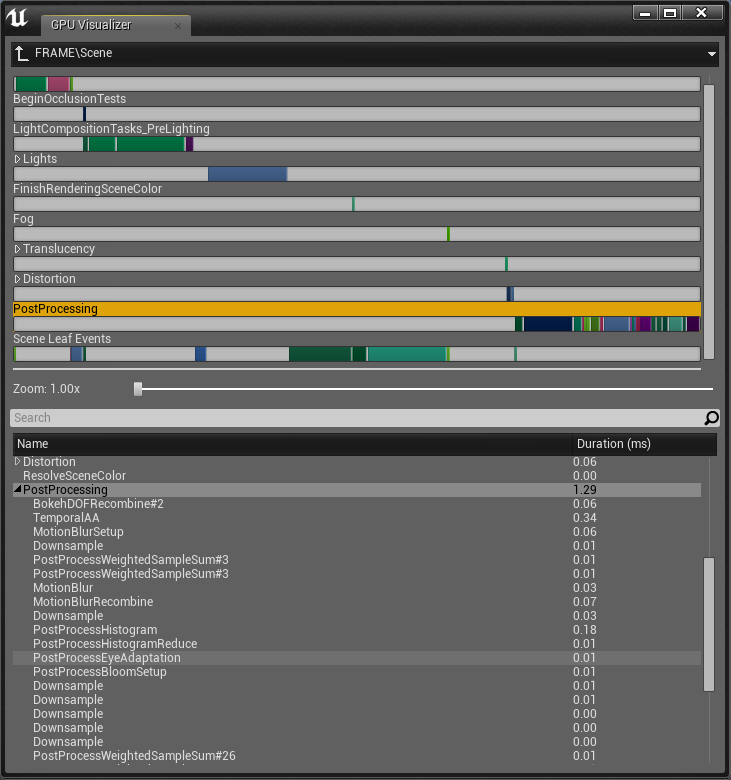
Another quick example is the Post Processing. If you were to click on it instead, you can see the various steps taken during the post processing and how long they took to complete. In a game where you use post processing a lot, this could easily take up a lot of your GPU time and this can help you pin point the problem.
CPU Profiler
Sometimes, looking at the GPU isn’t enough or even what you need. In some cases, we need to look at the CPU instead and see how it is spending its time. We can do this as well in UE4 with two simple commands. Unlike the GPU profiler which is only over 1 frame of time, the CPU profiler is over a duration. You tell it to start, you tell it to stop, and every frame between those two commands will be saved. This data can be loaded into the profiler for extensive looking. To start a CPU profiling session, you want to use stat startfile. To end the profiling session, you want to use stat stopfile. If you need to do this often, it might be useful to make these console hotkeys. If you look in your output log, it will tell you exactly where this file was saved and what it is called. To open up your profiling session, you need to first open the session frontend. This can be found under Window->Developer Tools->Session Frontend. Go to the profiler tab, click load and find your profiling session. This may take a while, especially if you profiled for more than a few seconds. You’ll end up with something like the image below.
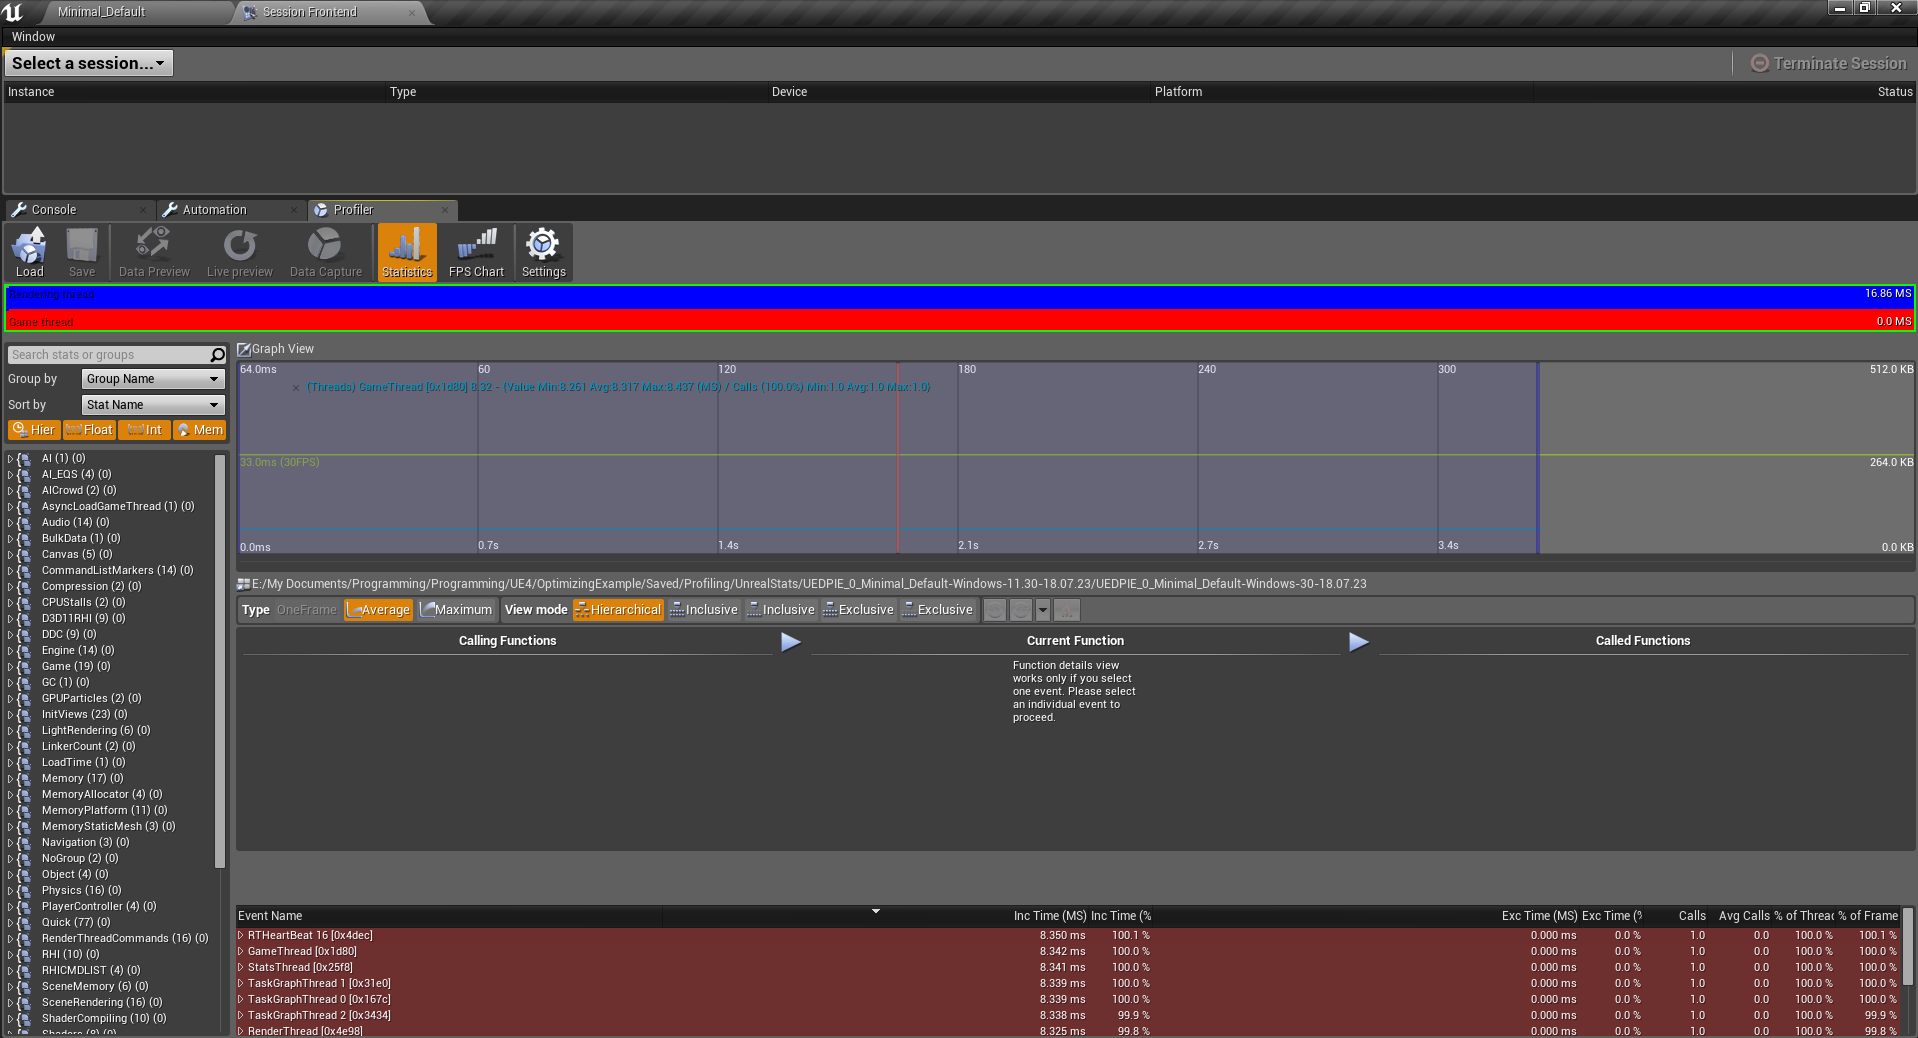
Unlike the gpu profiler where everything felt fairly straight forward, this one has a bit more to it and might be a bit more difficult to understand. I have gone ahead and marked the sections in the image below and i’ll give a brief explanation of what they do. These aren’t necessarily their official names (I don’t actually know what Epic calls them), but they are named based on what they do.
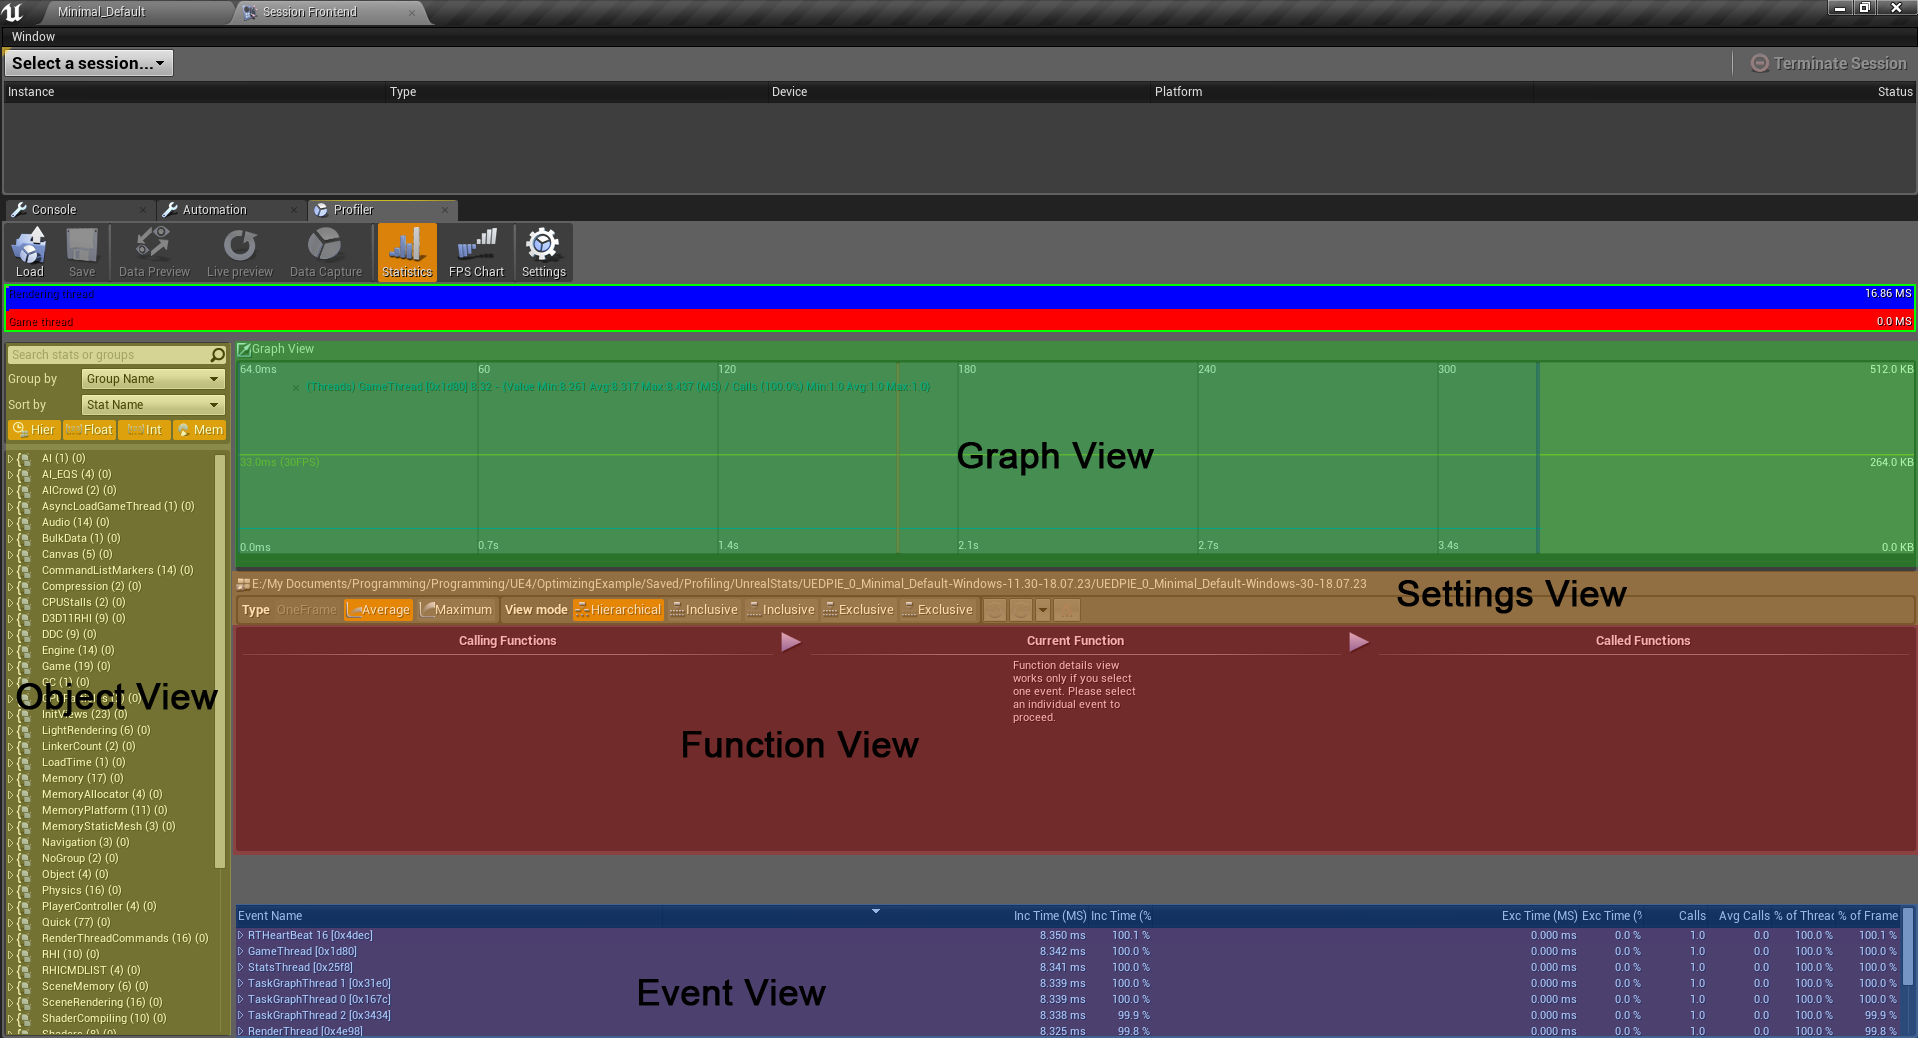
Settings View This view shows you the various ways to organize the information displayed in your function view and event view. For example, if you have selected more than one frame in the graph view, you can show the average or maximum values in the event view. Or if you selected an event, you can view your functions in hierarchical mode.
Graph View This view shows you the timeline for your profiling session. Lets say that it was profiling for 3 seconds, it would show you 3 seconds worth of data there. If you click or click & drag on it, you will select a section of time to look at more specifically.
Object View This view shows you everything that used the CPU during your session. This will be everything from physics calls, memory, AI, ticks, etc. It will go down to the individual actor or component in your scene which makes it very useful. By double clicking one of these, like the character controller, it will show up in the graph and you can then use that to determine what was going on when things got slow (visualized by spikes).
Event View This view will show you all the events which occurred during the time frame you have selected on the graph for all of the objects you have selected from the object view. This view tells you how long each event took to execute, the number of calls and more. If you have more than one frame selected, it either shows the average or maximum (depending on what you have set).
Function View This view shows you which functions are being called by an event. You can go forward or back through the functions. This shows information such as how long it took, how much % of the event it was. This can be very helpful to pinpoint where the problem is.
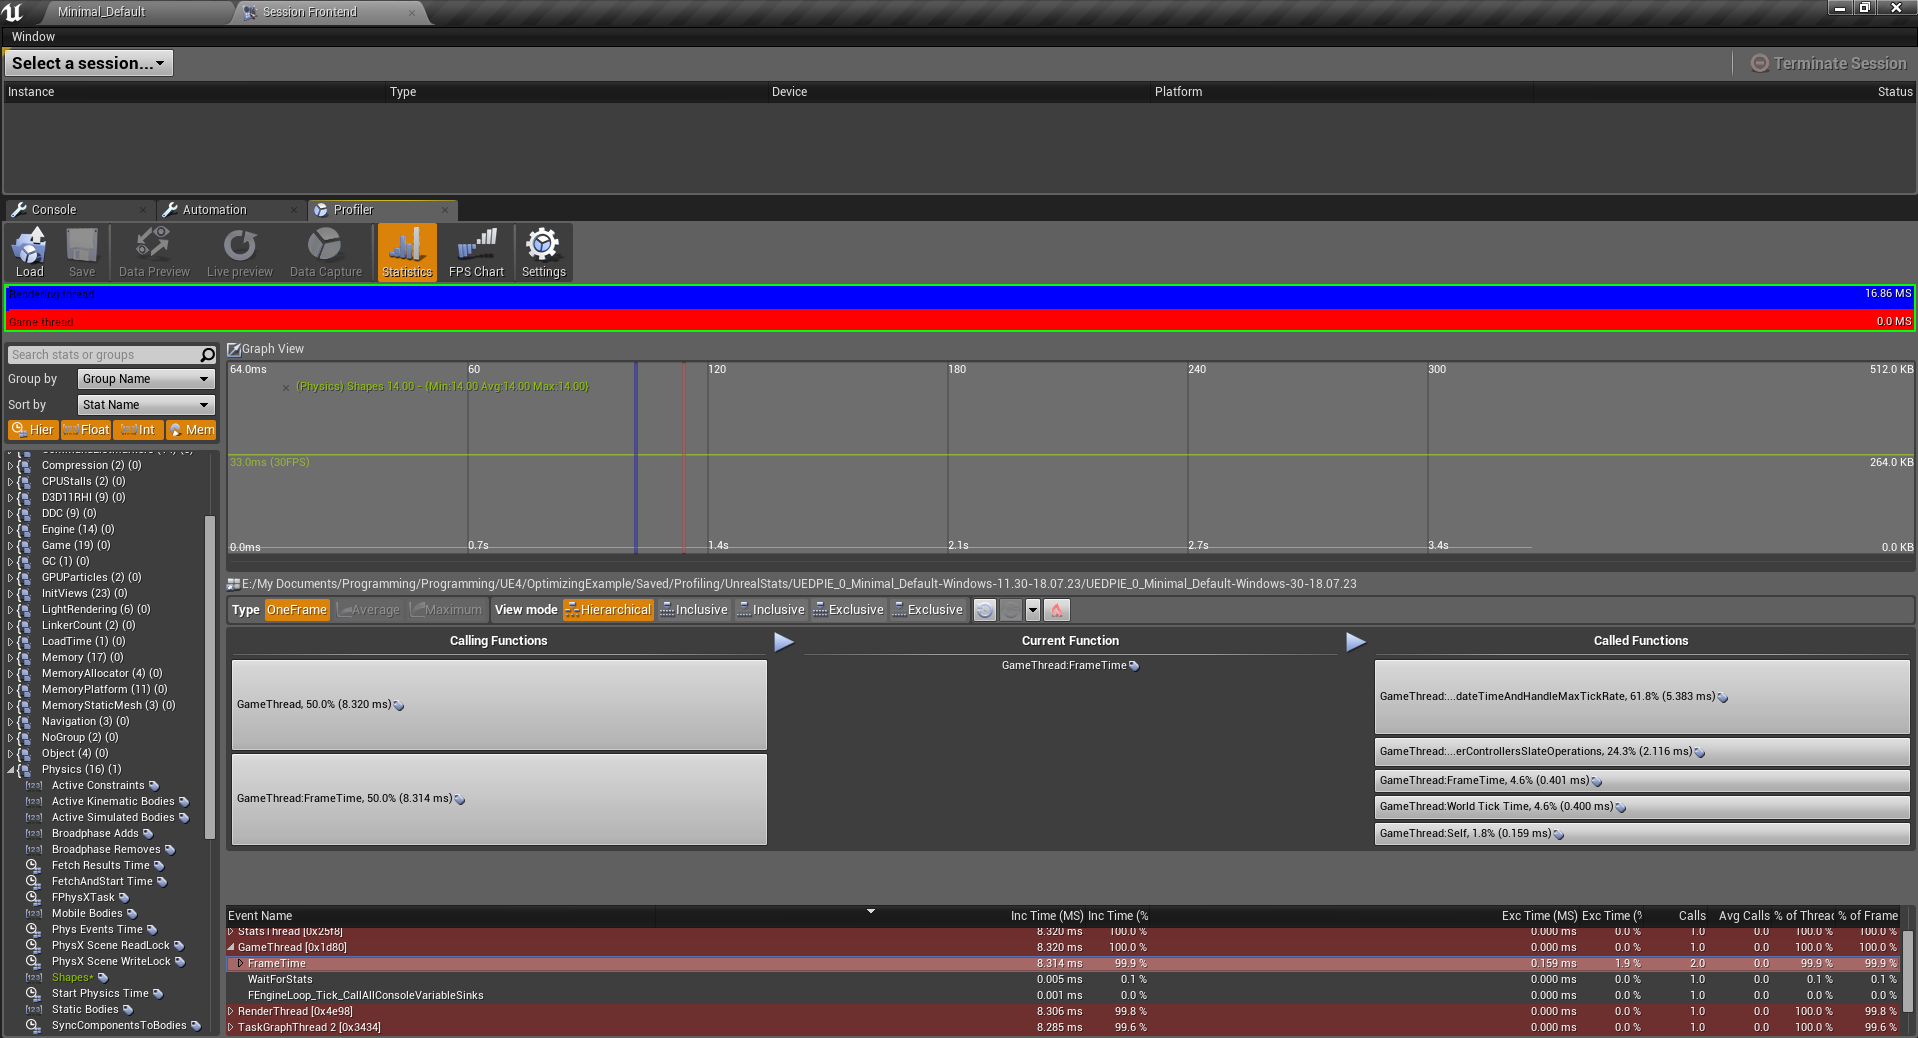
I have an example of this below where I selected the Shapes from the Physics Group in my object view. I opened up the GameThread’s FrameTime event which you can see in the function view. This is not a great example simply because there isn’t anything significant going on in the graph view (its all flat). But a good example would be something that has spikes in the graph so you can see what is causing it to spike so much. If it wasn’t clear, spikes are bad.
View Modes
Visualizing data is always a good way to prove that something is good or bad. Unreal has some very useful view modes in the editor to allow us to do just that. By default, your scene will likely be on “Lit”. What this means is that it will look like whatever your game will look like in game, lighting and all. But this is far from the only way to view your game from the editor. There are 4 others in particular that I find very useful while developing games in Unreal. They are Wireframe, LightComplexity, ShaderComplexity and Unlit. You can find these view modes in the top left of your view port.
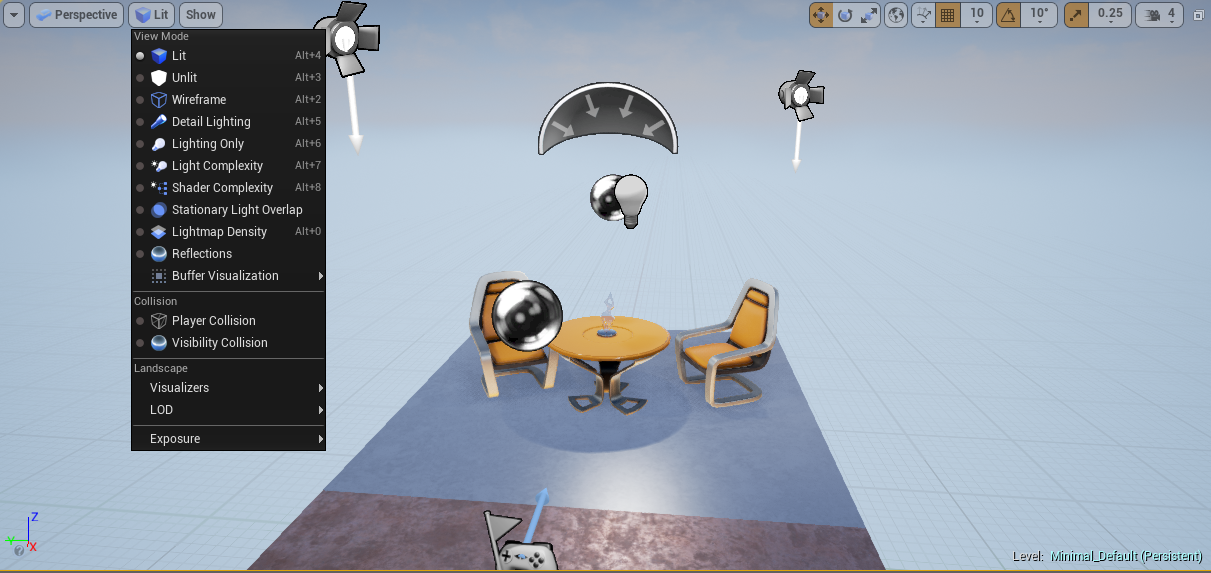
For reference, my scene is shown in the “Lit” view mode.
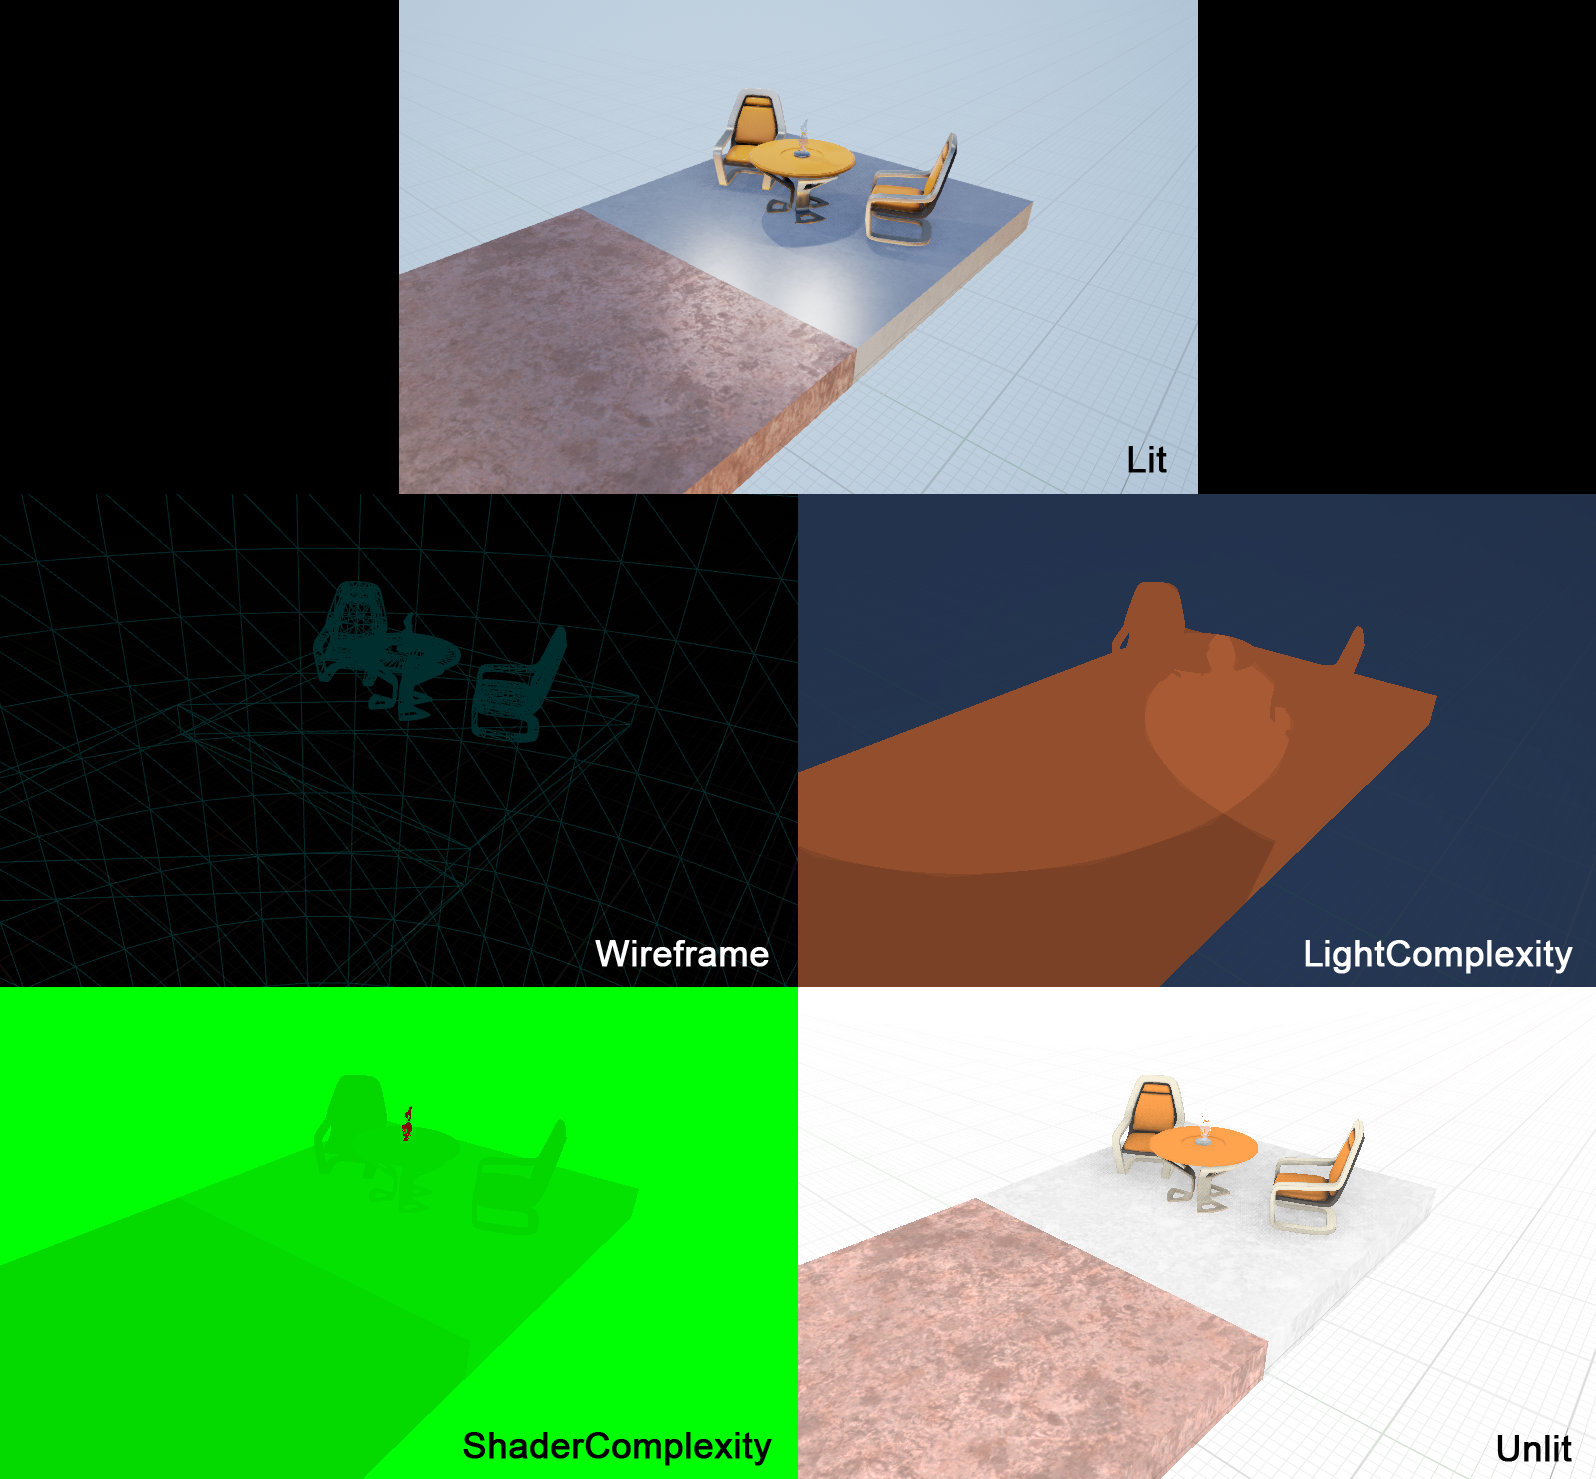
Wireframe This is exactly as you would expect it to be. It only displays the wireframes for everything in the scene. This can be useful to see just how many tris are in a scene and perhaps better judge whether or not something can be reduced. Also useful to see problems with a mesh (although it might be better to do that in something like Maya).
LightComplexity This shows you how complex the lighting in your scene is. While it might look like abstract art at first, it actually gives a pretty good indication of where you have a lot of lighting overlap and where your scene might have little to no lighting. In terms of perfomance, darker is better so keep that in mind. In the example scene above, I have a few lights placed to help show this complexity better.
ShaderComplexity This is somewhat similar to LightComplexity execpt it applies to shaders only. You want this to be as green as possible. If you see colors like red or white, you might want to go investigate that part of your scene as this is generally a bad thing. For example in the image above, the glass on the table has a high shader complexity which is likely from its transparency and reflectivity.
Unlit If your game is generally fairly dark and difficult to see things, do yourself a favor and put your view mode to unlit. It will make working much easier. Unlit mode does exactly as the name suggests; it renders your game with no lighting at all. This has no benefit for improving performance, it is just a suggestion.
Lighting
Probably one of the first things that comes to mind when optimizing your game is your lighting. Lighting can be a powerful tool, especially in Unreal Engine 4. However, depending on how you’ve set it up, it can be very costly and have a huge impact on your game’s performance. There are a few things that you want to know about lighting in Unreal so you can keep your game running smoothly.
For starters, use static lights if you can. Just because you want to light a room doesn’t mean it has to be dynamic or even stationary. If you don’t need to modify the light during game, make it static. Static lights are practically free because Unreal just bakes the lighting and it becomes essentially just a texture. If you are doing mobile or VR, you want to almost exclusively use static lights to keep your framerate up.
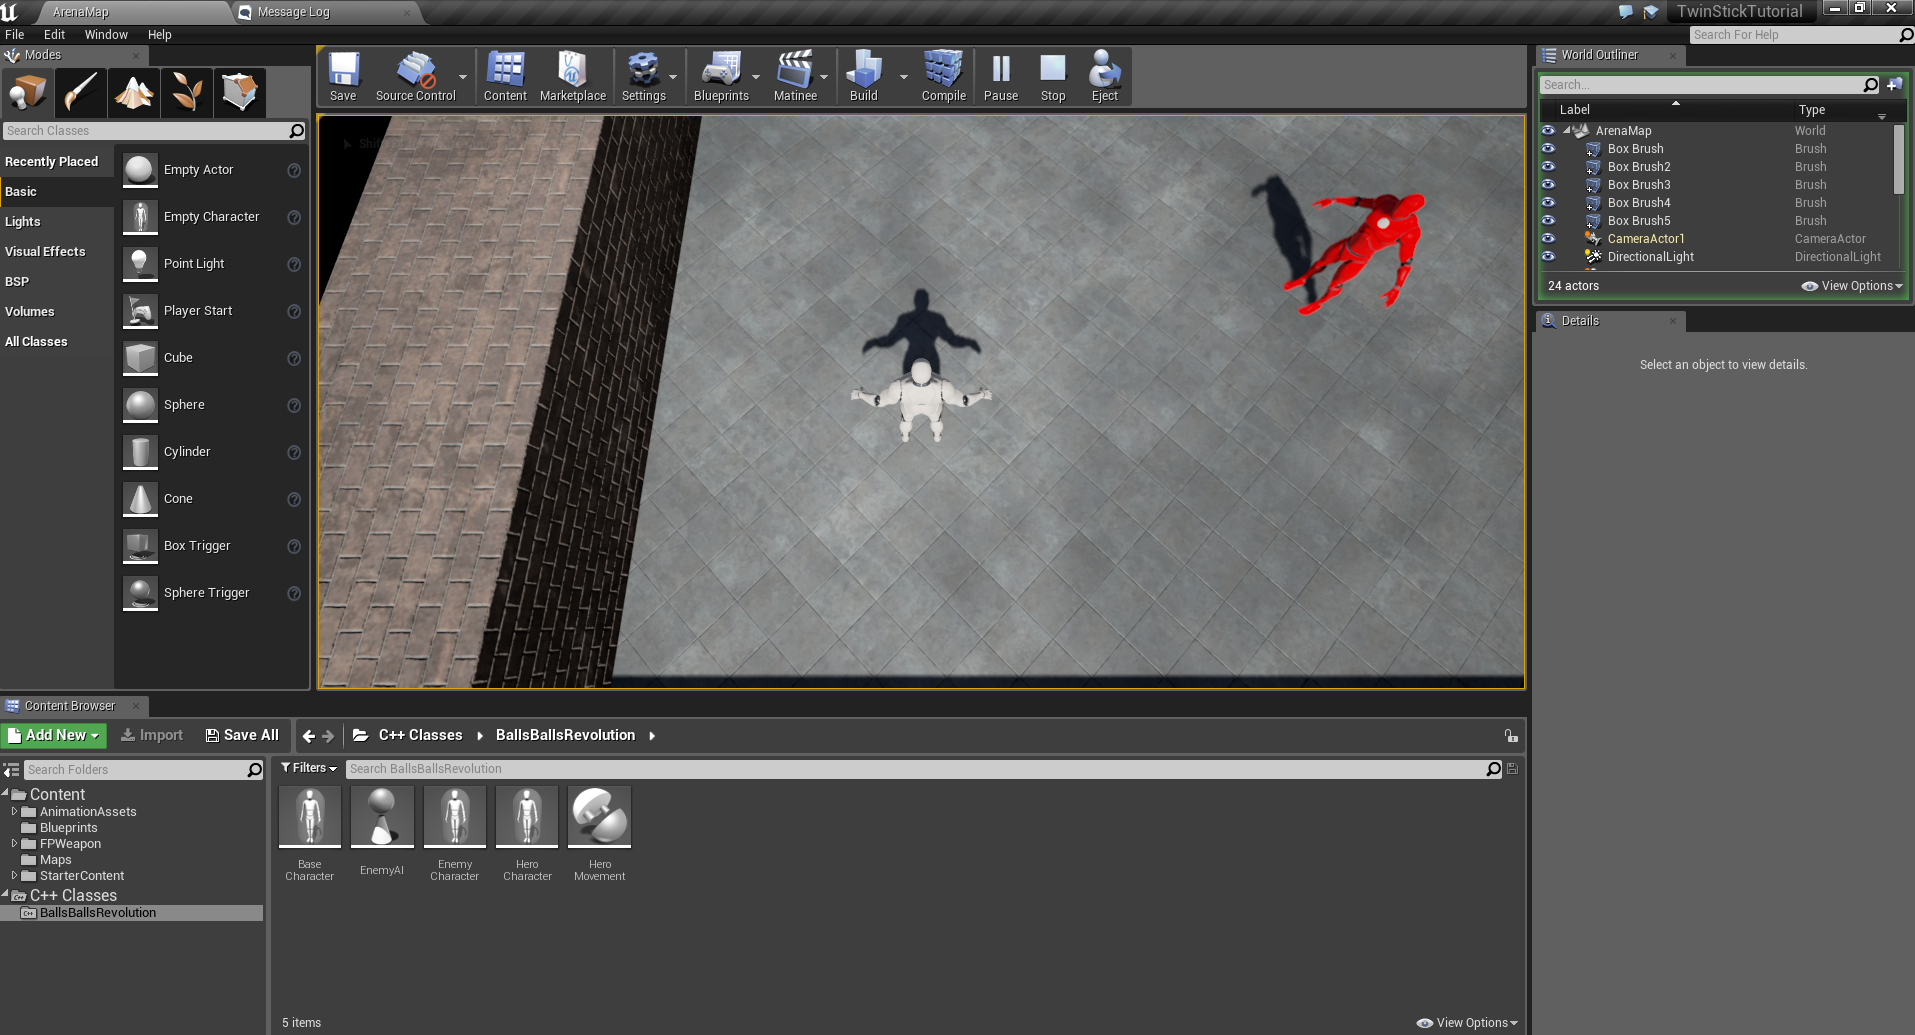
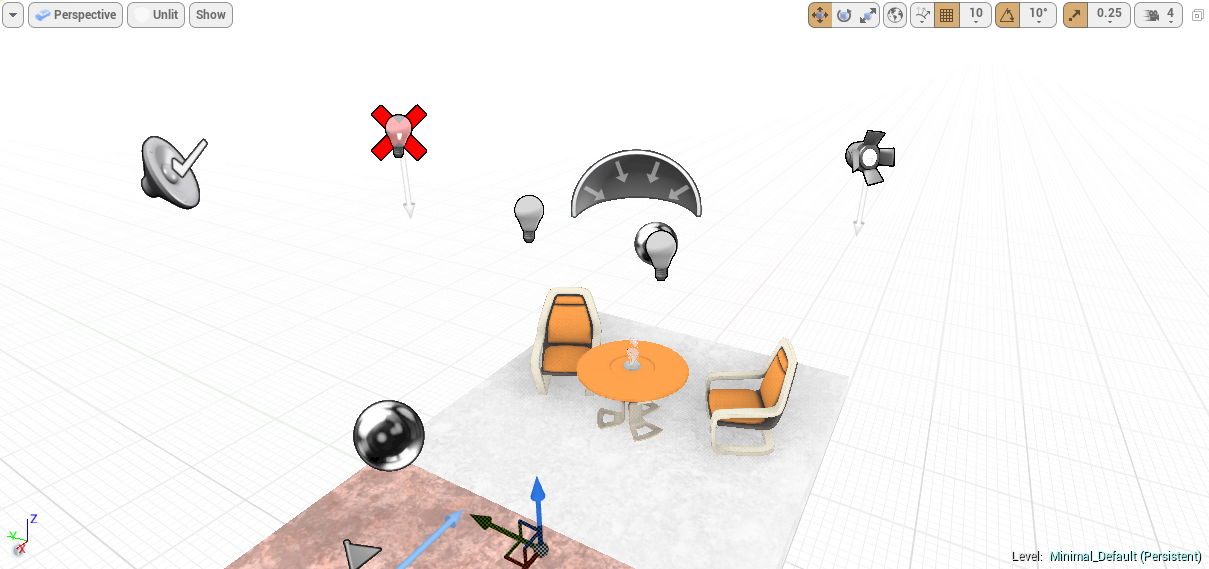
Stationary lights are the next best thing you can do when placing lights in a scene. If you need a light to change its intensity or even turn it on and off during gameplay (lots of gameplay mechanics can be derived from lights), this is what you want to be using. But be mindful of the shadows. You don’t want too many lights casting shadows as this destroys your performance. Stationary lights, like static lights are also baked and are very cheap. Just make sure to avoid overlapping more than 4 stationary lights at a time. When Unreal bakes stationary lights, it bakes it in every combination of the overlapping lights being on and off. This is why it limits it to 4. This doesn’t mean you can’t overlap more than 4, however. It just means that any other lights that overlap will become dynamic lights. This can be seen in the editor as a big red X over a light’s sprite in the editor view port (see image below). Note: If you are using a directional light in your scene, this will count as an overlapping light.
Dynamic lights should be your final choice of light. If you need your light to move, like a flashlight being carried by your player, then this is what you want. Dynamic lights are the most expensive because the lighting calculations can’t be baked so just try to reduce the amount you need if you can.
I’ve mentioned this before, but it is important to mention again; minimize the number of shadow casters, especially in dynamic lights and point lights. Shadow casting is very expensive and if you have too many, you will have a noticeable drop in performance. It is generally better to have a bunch of static/stationary lights in your scene to do lighting and then a small amount of shadow casters to get the desired effect. Just because you want shadows doesn’t mean you need every light to cast them and there are tricks to reduce this which I won’t cover.
Another thing you can do to improve your performance is by changing point lights to spotlights. This is because what the engine does in the background for point lights is create 6 lights for each direction on a cube which is then used for stuff like shadow casting. This means that it is generally more expensive to have them than a spotlight. If you don’t need a point light and can get away with a spotlight, it is a good idea to switch them.
You also want to be careful of the light’s radius. If the radii is too large, then it will become more expensive to render because the calculations will have to be done to more objects. While this is less important for static lights which get baked (it does increase the baking time), it is more important for dynamic lights and shadow casters. Try and reduce your lights radius as much as you can get away with.
Lastly, you want to be careful about IES textures on lights. This is essentially a texture which defines how to shape a light. You can find this on a light under Light Profiles. A good example of this would be a flashlight. Flashlights aren’t perfect spotlights, they have noticeable rings due to the plastic or glass infront of the actual light bulb. You can replicate this effect on a light with IES textures. Lets say that your artist decided to put a point light in the scene for your flashlight object and used an IES texture to shape it like a flashlight. While it looks great, you might down the road notice that your flashlight is a huge resource cost to the GPU. The IES texture made it difficult to realize that it was using a point light when it could just as easily have been a spot light which would be far more efficient.
Emitters
Particle Emitters are a great way to make games look even better and make them more immersive. Dust clouds in the desert, snow on the mountain tops, muzzle flashes on guns. There are lots of uses for them and lots of ways to absolutely kill performance with them. It is important to just keep in mind a few details when creating your particle effects.
For starters, lower how many particles are being created on the CPU. It is just not a great idea to be using the CPU if you want lots of particles. It will just slow your game down and is a waste of the CPU’s time. Use GPU particles whenever you can.
You should also use particle lighting sparingly. Particle lighting is expensive and while it might look great, it is significantly cheaper to just use a regular light to do that light component. Either replace your particle lighting with stationary/dynamic lights or make sure you use very very few of them. To give an example of this, in one of the games I worked on recently we were using particle lighting for flares. If you had more than 4 flares in the game at a time, your framerate would tank below 40 FPS from 60. When we switched to using dynamic lights (no shadows), we could easily have 20 with no impact on performance.
A useful trick to make particle emitters impact your performance less is to aggressively use LOD.*. This will mean that your game will only have heavy particle use when they are near the camera which is viewing them, meaning you can have more particles with less of an impact.
Another thing you should do is reduce the number of emitters being used in your particle effects. One of the speakers at MIGS gave a great example of a particle effect which looked amazing but absolutely slaughtered the performance. It was an amazing looking muzzle flash that was used in the Infiltrator demo that Epic released back in September 2015. They tried to use it in an actual game for shooting but quickly realized that it killed the performance. When digging deeper into it, they realized that not only were they not reusing the emitters from the particle effects, the effect itself also had 24 emitters. This meant that 24 emitters were being created for each time this effect was used. They eventually reduced the 24 emitters down to around 4, all while maintaining a decent looking effect. This gave a significant increase to performance and it no longer killed the frame rate.
Lastly you should also reuse emitters whenever possible instead of making new ones. Its more expensive to create a new emitter than to just move an old one that isn’t being used anymore. I would recommend creating an emitter pool for emitters which are frequently used; this will have a large increase in performance.
* LOD stands for Level of Detail. It is where you decrease the visual complexity of something the further it moves away from the viewer (in this case, the camera). Mipmapping in textures is an example of this.
Post Processing
Post processing is very powerful and is able to do a lot of useful things for games. It can also take up a lot of time each frame. These are just a few tips to make sure you are getting the best performance from your post processing effects.
You should never use more than one post processing volume in a scene. It doesn’t make sense to do it in the first place and it won’t help. A good way to think about it is that if you pay a guy to paint a room white, it wouldn’t do much good to pay another guy to do the exact same thing to the same room afterwards since it is already white.
If you are profiling your game with the GPU profiler I talked about earlier, you might find your post processing takes a lot of time. While you might think its ok to keep throwing things at post processing, sometimes it isn’t the solution. To make sure you are getting the best performance, only use what you need.
Lastly, be careful with post process materials like Blendables. These are fairly expensive and will likely make post processing an even more expensive operation for your game to do.
Meshes & Materials
It is not uncommon for there to be performance problems with your meshes and materials. While your artists might be good at making materials and meshes that look very nice, they are likely less skilled at making sure these are optimized and run well in game. This is where a programmer usually comes in to help out. Here are some things to keep in mind while improving your mesh and material performance.
Keep the number of bones in your skeletal meshes as low as possible. Your character doesn’t need to have anatomically correct bones.
Watch your vertex count on meshes. Computers in our day and age might be powerful, but it never hurts to use the lowest vertex count possible. Also avoid having creases in your mesh; this is what normal maps are for.
Make sure to use as few islands as possible in your UV maps. If you use automatic mapping algorithms to do the bulk of your UV maps, it is fairly common for them to cause this.
Keep the instruction count in your materials as low as possible. Materials with a higher instruction count will cause a noticeable impact on performance, especially if it is rendered frequently. A good number to shoot to be under for something that tends to have a lot of screen time is around 80 instructions. But keep in mind that the number will be different for every game and platform so don’t think this is set in stone.
Make sure that there isn’t overly complicated vector math in the material. Don’t re-invent the dot product.
Be careful with layered materials. Layers can help make a material look really good but it also comes at a large performance hit. If you can afford to, flatten as much of these textures as you can. Any more than 2-3 layers should probably be reduced.
Be mindful with your translucency, especially with lit materials. These are more expensive to render.
Lastly, utilize the material quality settings. These are there to help you easily swap out materials based on the quality settings in the game. In your material blueprint, just create a Quality Switch node and plug that into the setting you want to change based on quality. For example, you could change the roughness of the material to have more noise at a higher quality.
Blueprints
Blueprints are a great way to do a lot of things in Unreal Engine 4. From small scripts and components to gameplay mechanics and more. The best part is that they are friendly to designers and those who are less comfortable with C++ to do coding. They do, however, come at a considerable cost. On average, blueprints are 8-10x slower than native C++ code. Before you go and say why bother using them, consider the fact that if your code isn’t doing anything crazy, it won’t make a huge difference. That being said, lets see a few ways to keep your blueprints as efficient as you can.
Use event based systems. There is no reason to be constantly polling for information and in a lot of cases, little reason to use the tick function. It is generally better to just setup some event dispatchers and use them instead.
Avoid the tick event. Sometimes, you need to do things on a per frame basis and that is fine, but you should avoid using tick whenever you can. It is fairly expensive for blueprints to be using it and it is likely you could just get away with using events. If you aren’t using tick, turn it off.
Send events directly to actors, don’t query things. Queries are slow and you should avoid slow operations in blueprints when you can.
Reduce the number of components a blueprint has. The more components a blueprint has, the longer it takes to spawn them in the world. Just ask yourself if you need a particular component before adding it.
Lastly, if there is something you want to run fast but still want to write blueprints, consider adding that particular functionality to a C++ function and just calling it from blueprints. This will give the native speed you need for that bit of code while keeping the rest easily accessible in blueprints.
Other Tips & Tricks
I spent a lot of time talking about very specific things and showing a few examples. While this post is fairly long, it only touches on a small fraction of the things you can do to help make your game run better in Unreal Engine 4. While I couldn’t possibly cover every aspect, there are still a few smaller tips and tricks which you can follow to help keep your game running smooth. I just have them listed below in bullet form.
- Reduce these:
- Overdrawing
- Dynamic Lights
- Draw Calls
- Shadows (These really kill performance so only have them when necessary and try to reduce how many shadow casters there are if possible)
- Material Instructions
- You can turn things off while in game with the command show (i.e. show particles). You can also do it through the editor in the top left where it says show. Turn off things that you don’t need while looking for a specific problem to help narrow it down quicker.
- Use stat unit & r.screenPercentage 10 to help determine if you are CPU bound or GPU bound. If your FPS goes up, you are GPU bound. If it stays the same, you are CPU bound.
- Make your UI event based instead of binding (binding kills your performance, especially if used often)
- Take a look at Epic’s documentation for Unreal Engine 4! There is a lot of really good information there and it is only getting better with time.